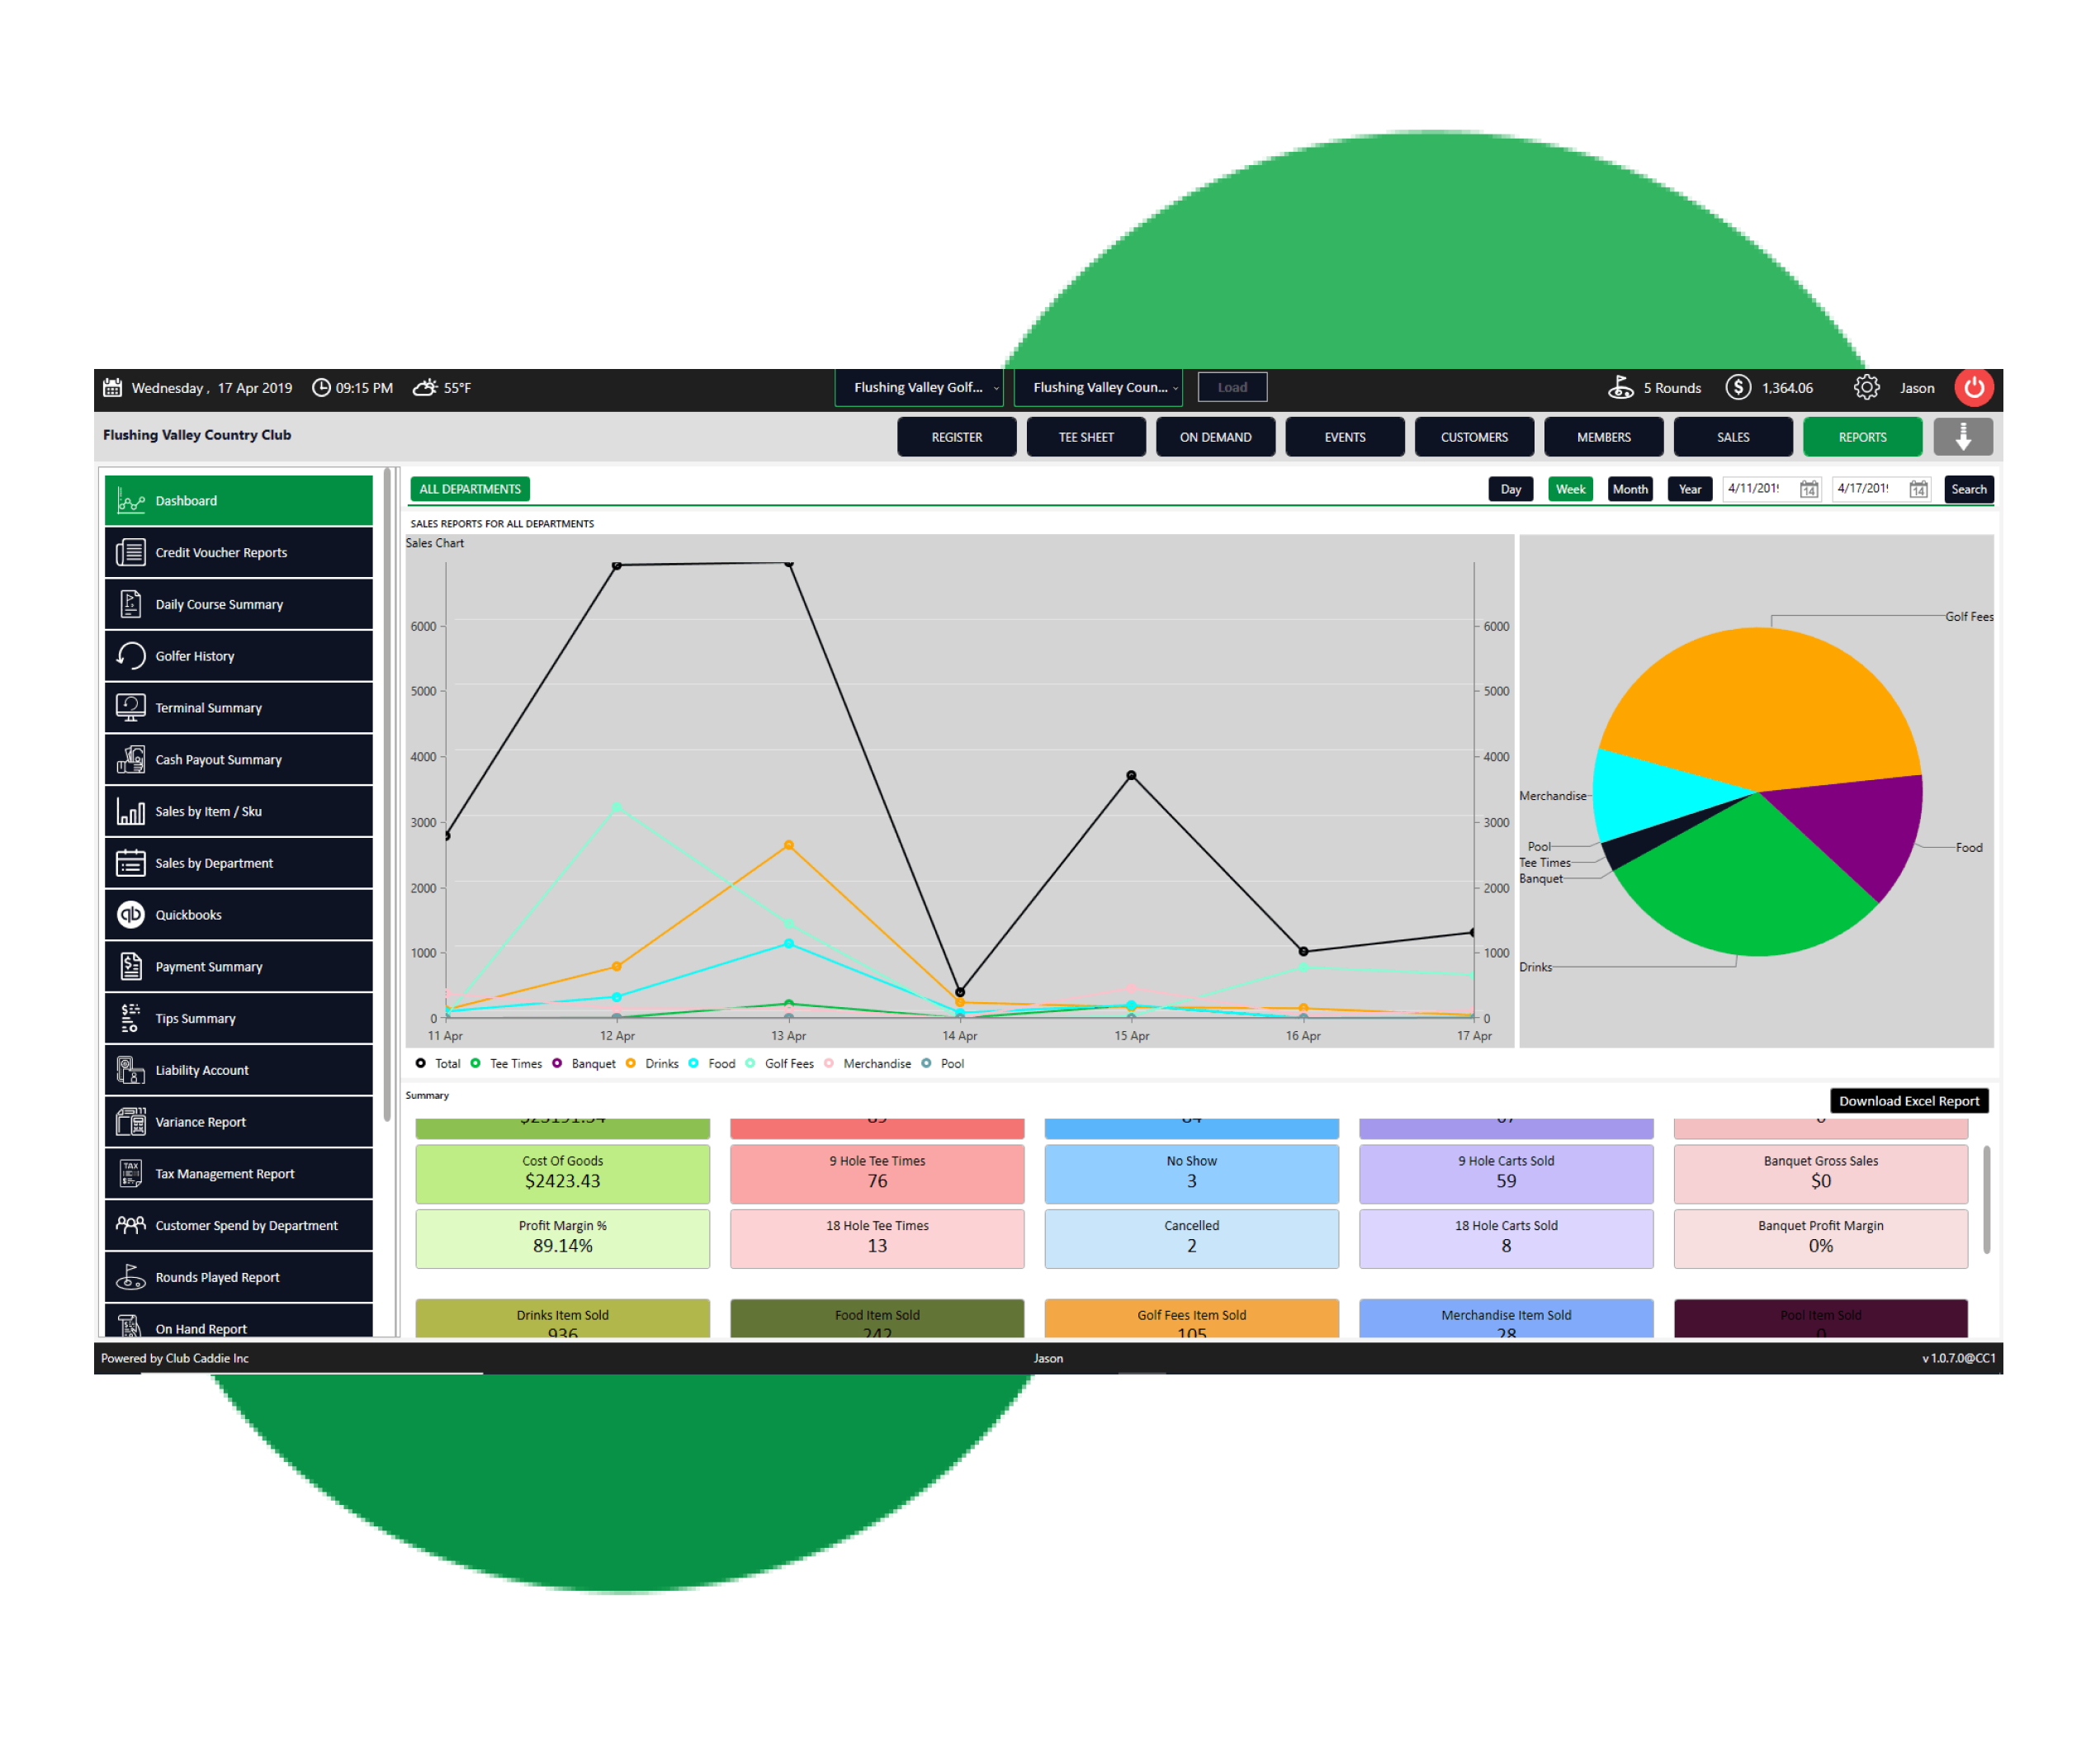
See revenue breakdowns for F&B, Banquet, Golf or any other department by Sales, Quantity of Items Sold and Profit Margin.
Compare sales year by year, month by month, week by week, day by day or hour by hour.
Export summary data to Excel with the click of a button.
Full Suite of Sales Reports
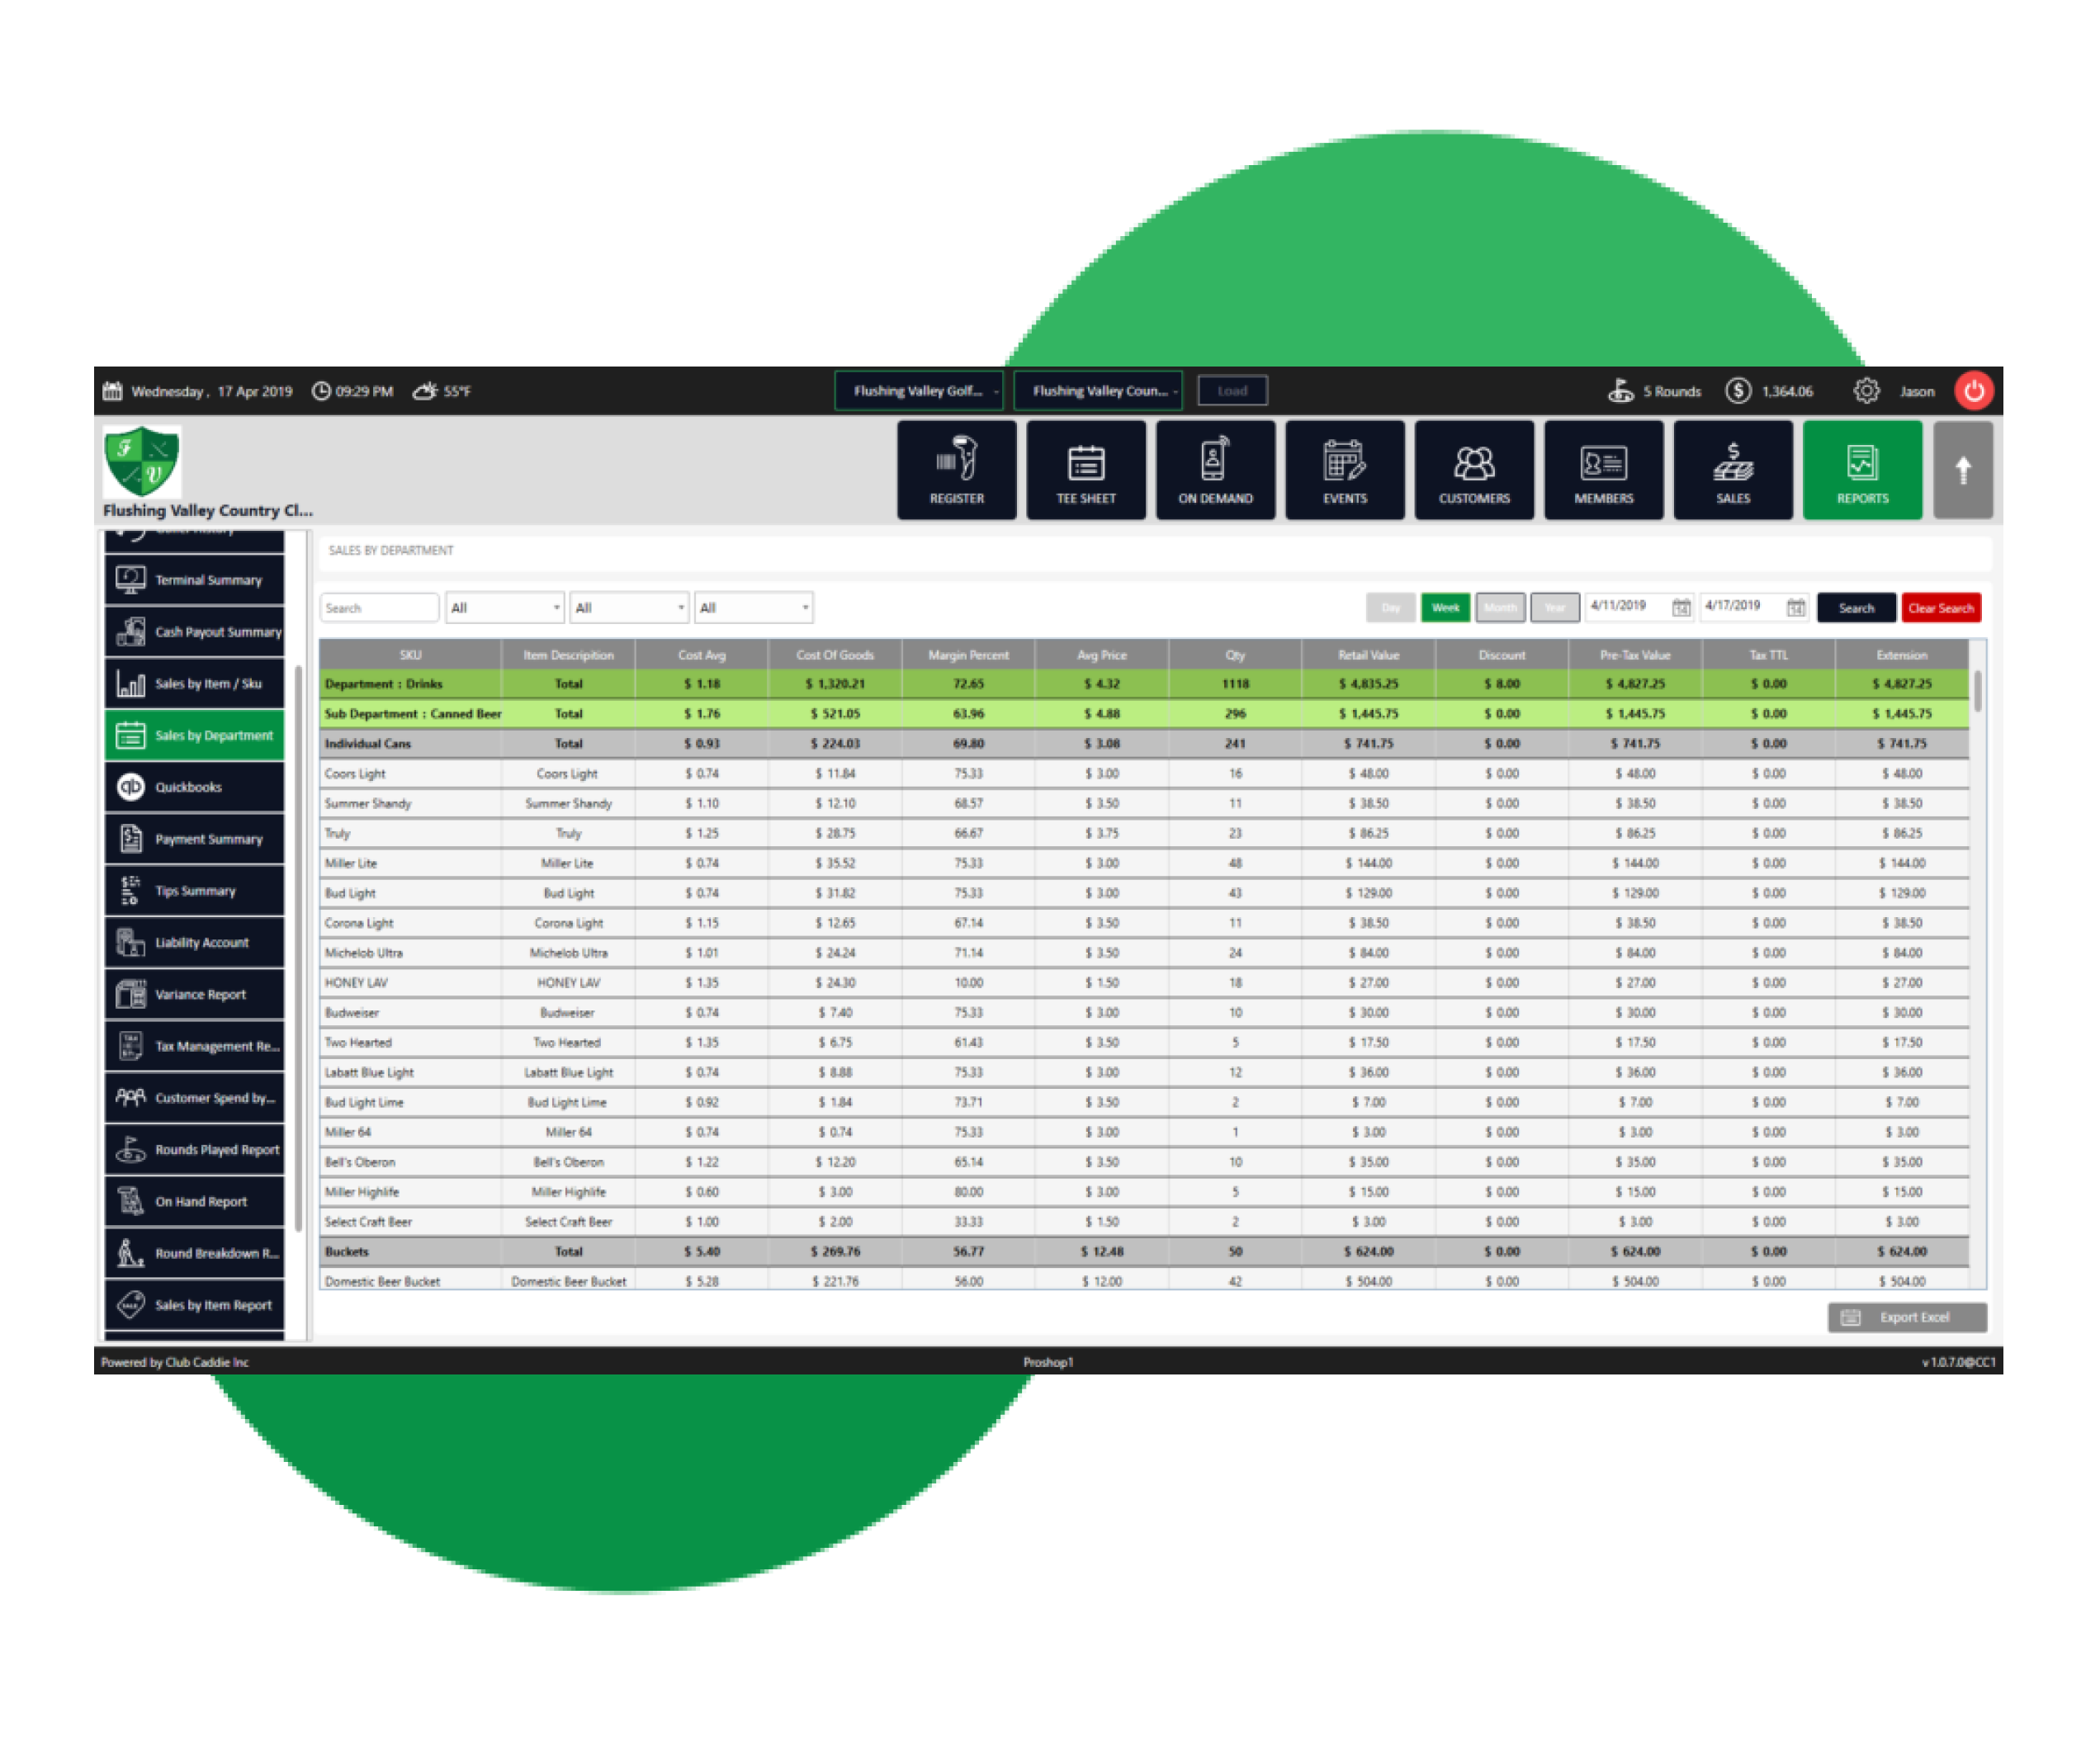
Sales by Item, Department, Event or Customer for Any Period of Time
Track quantities of items sold, profit margins, inventory levels, tax collected and much more.
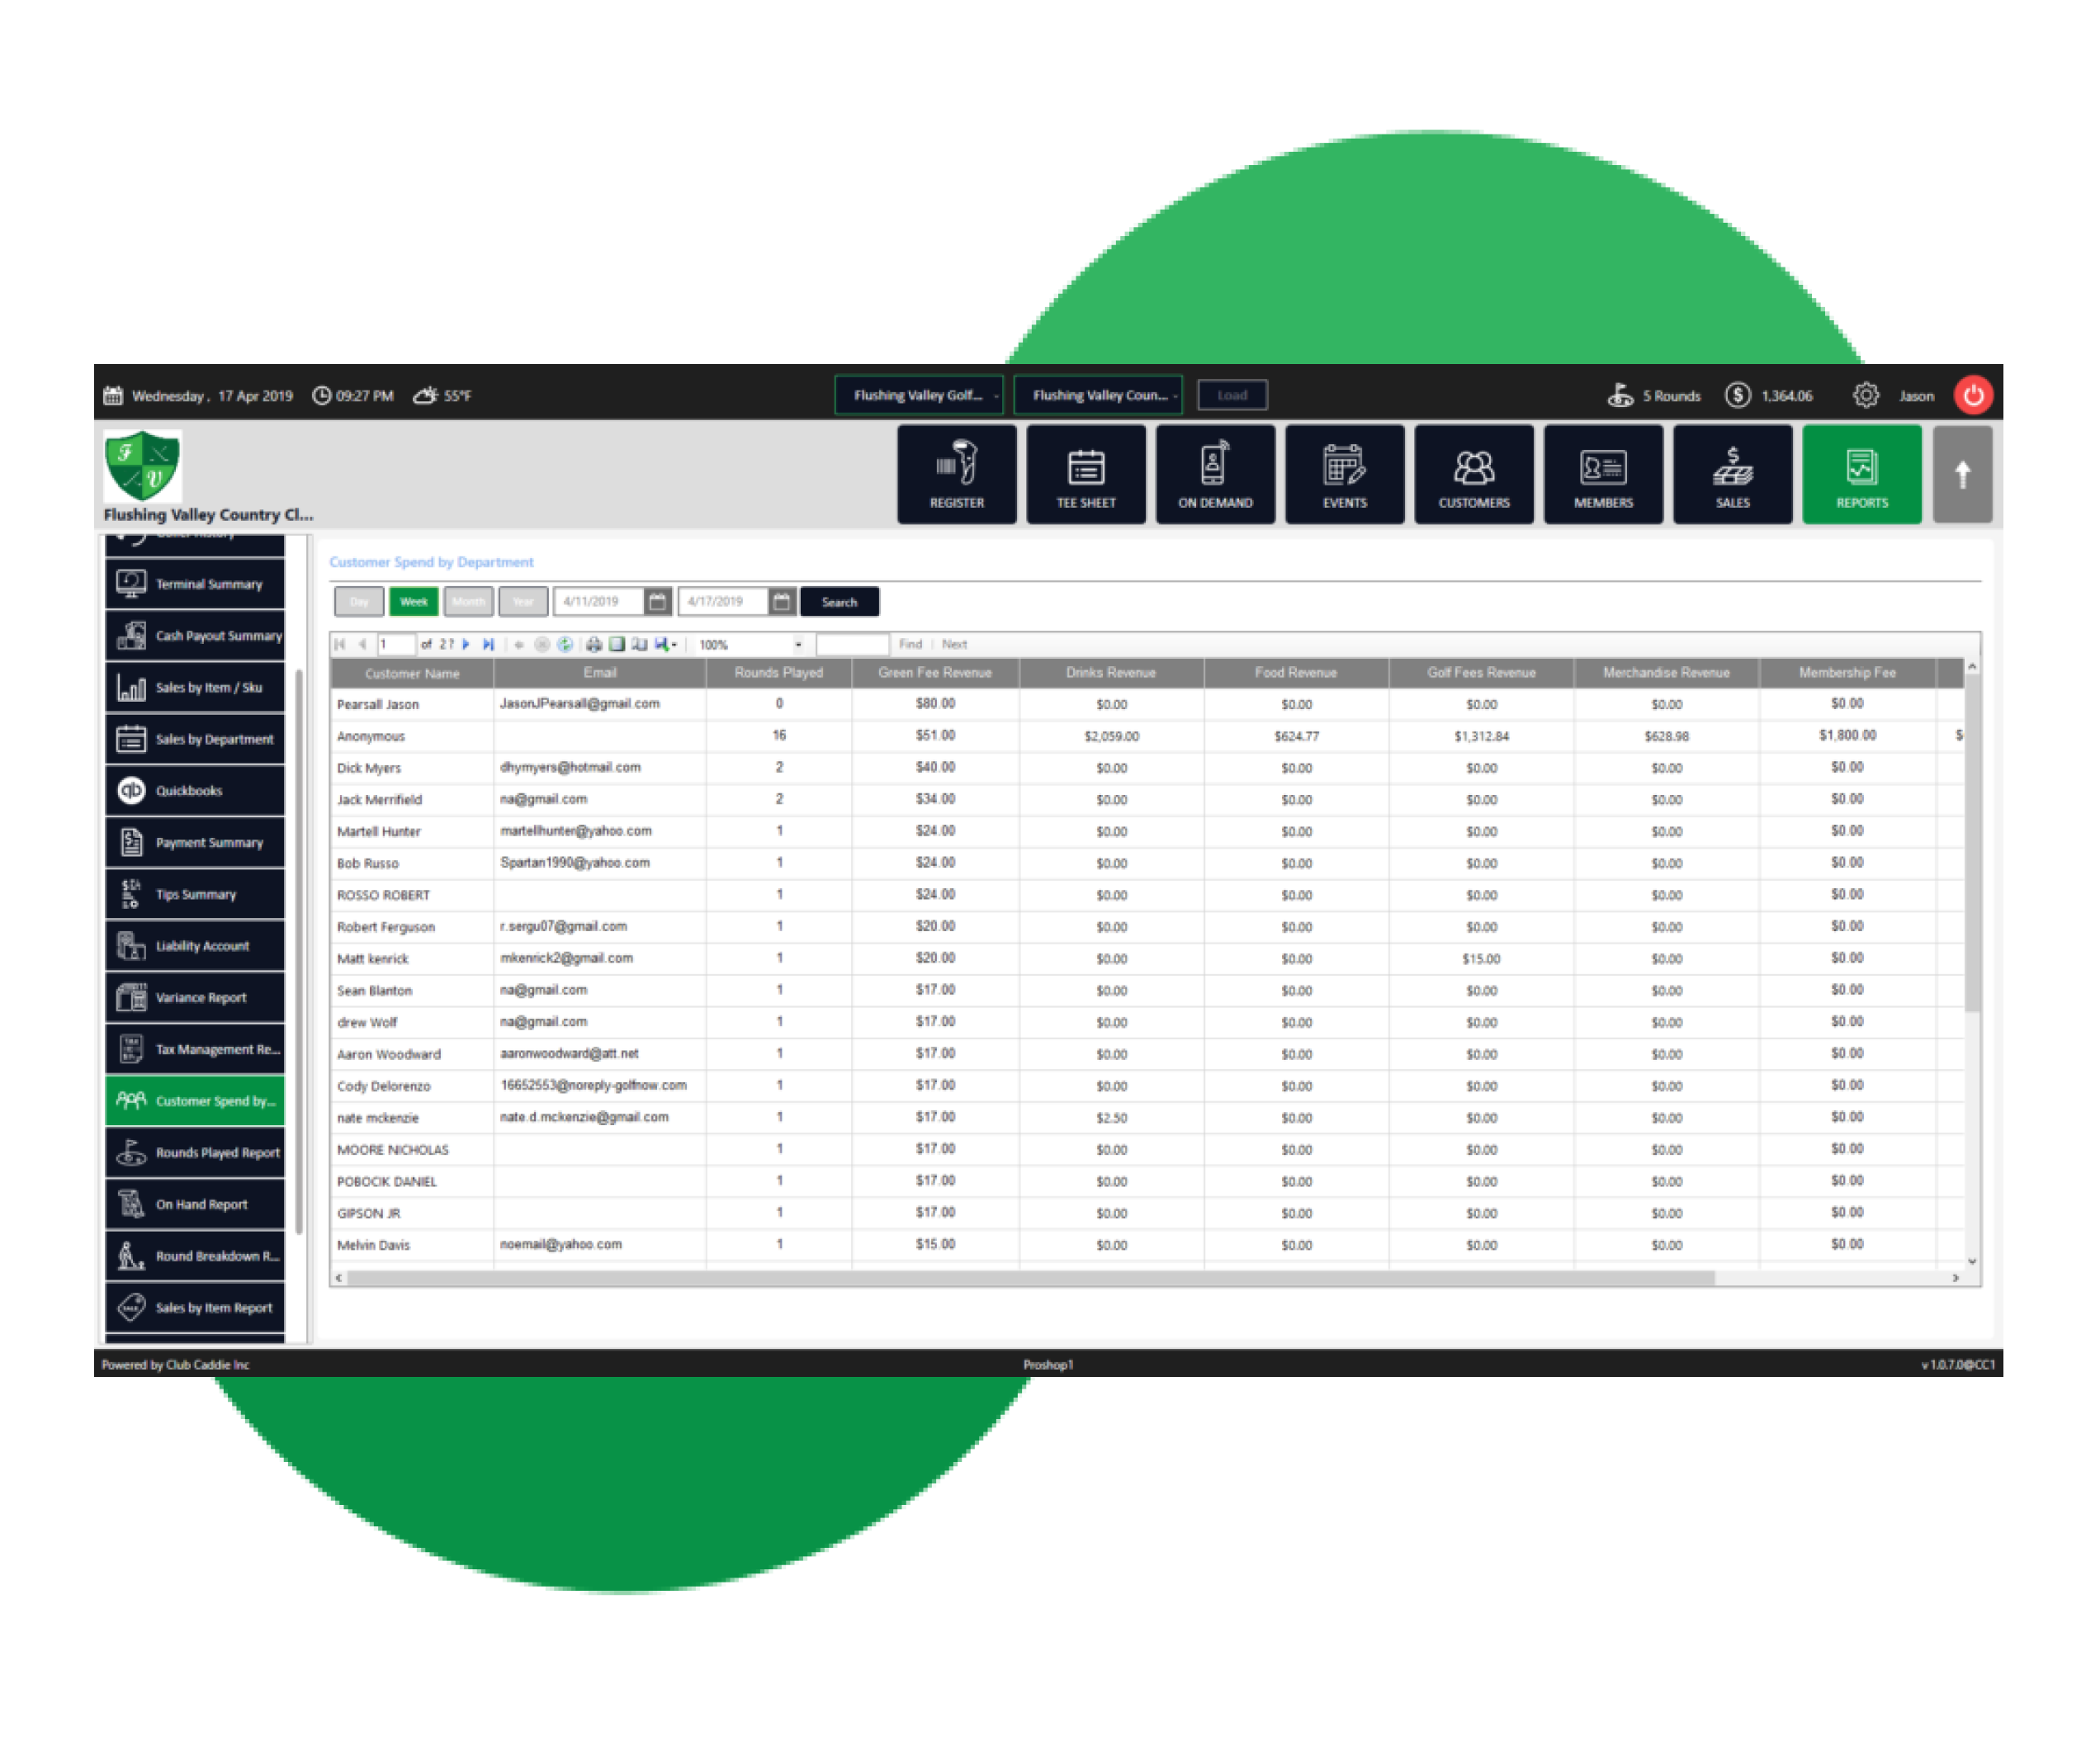
Golfer Playing and Spend History
Every Golf Report you could think of and then Some
Breakdown Golfers playing history, spend by department, purchase history and more for any period of time.
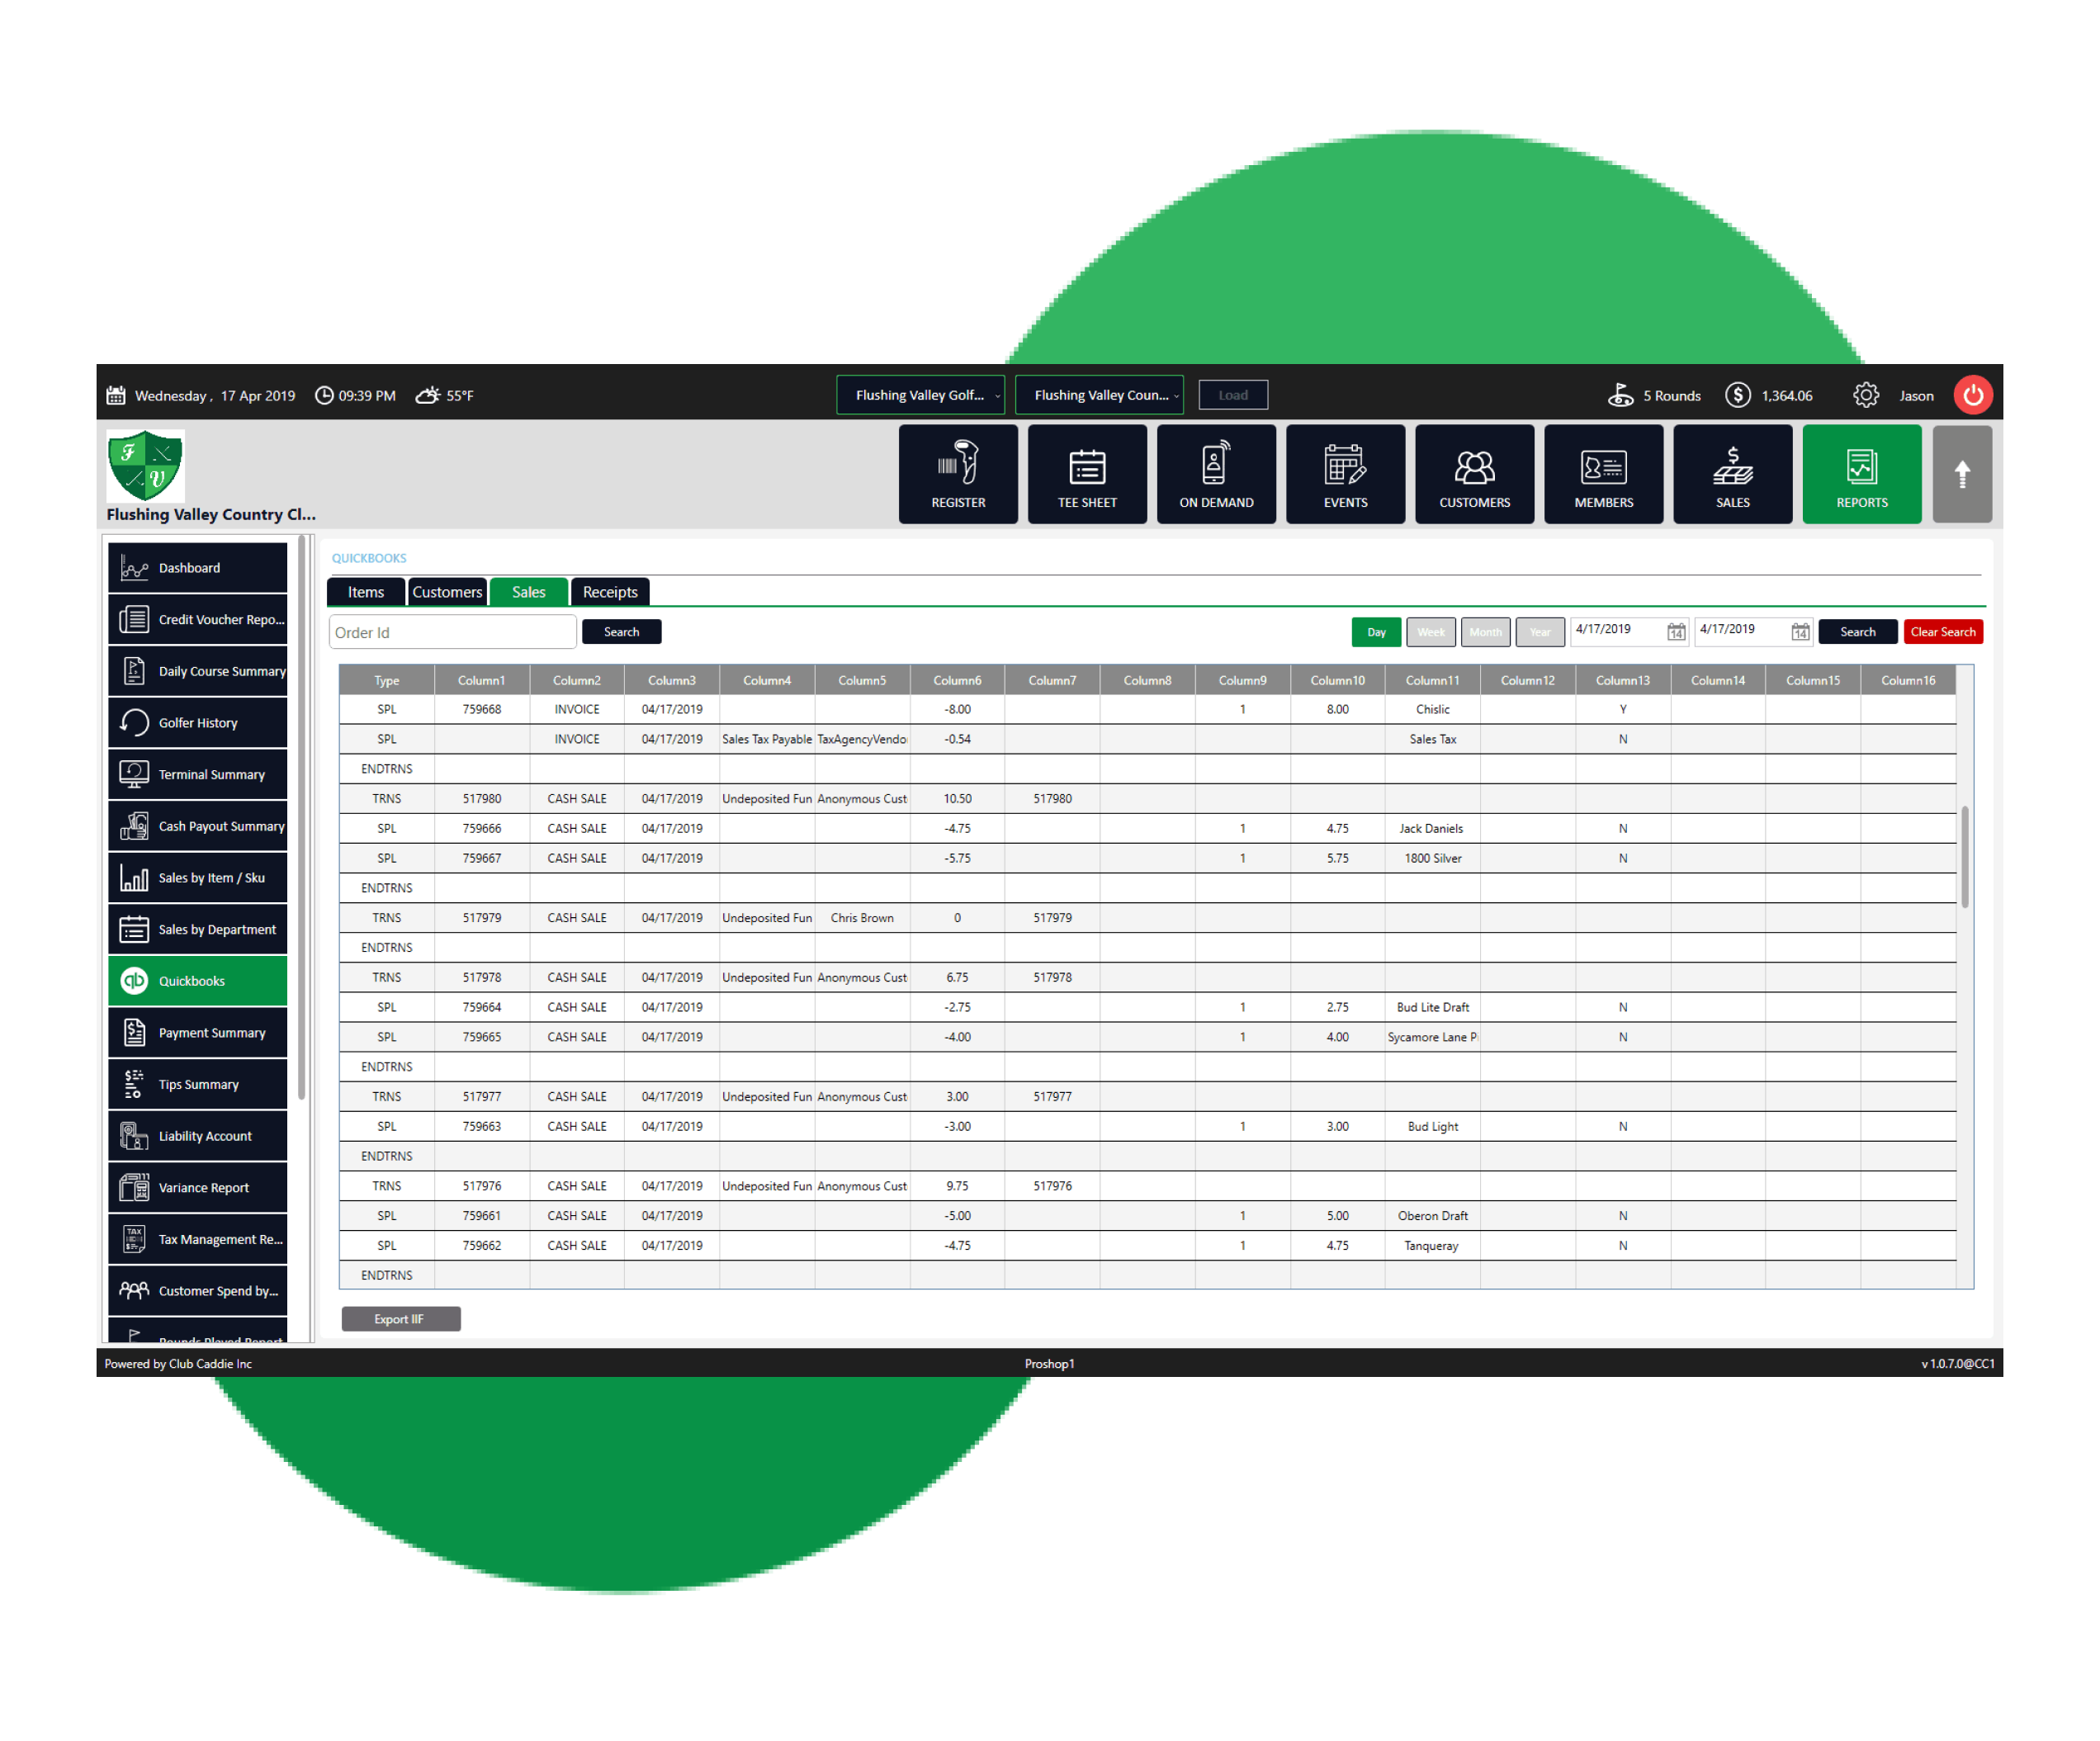
Quickbooks and Accounting Integration
Quickbooks Sync App
Export IFF Files or automatically sync your point of sale data with our Quickbooks Sync App on-demand at the click of a button or on an automated schedule to send as often as every day.
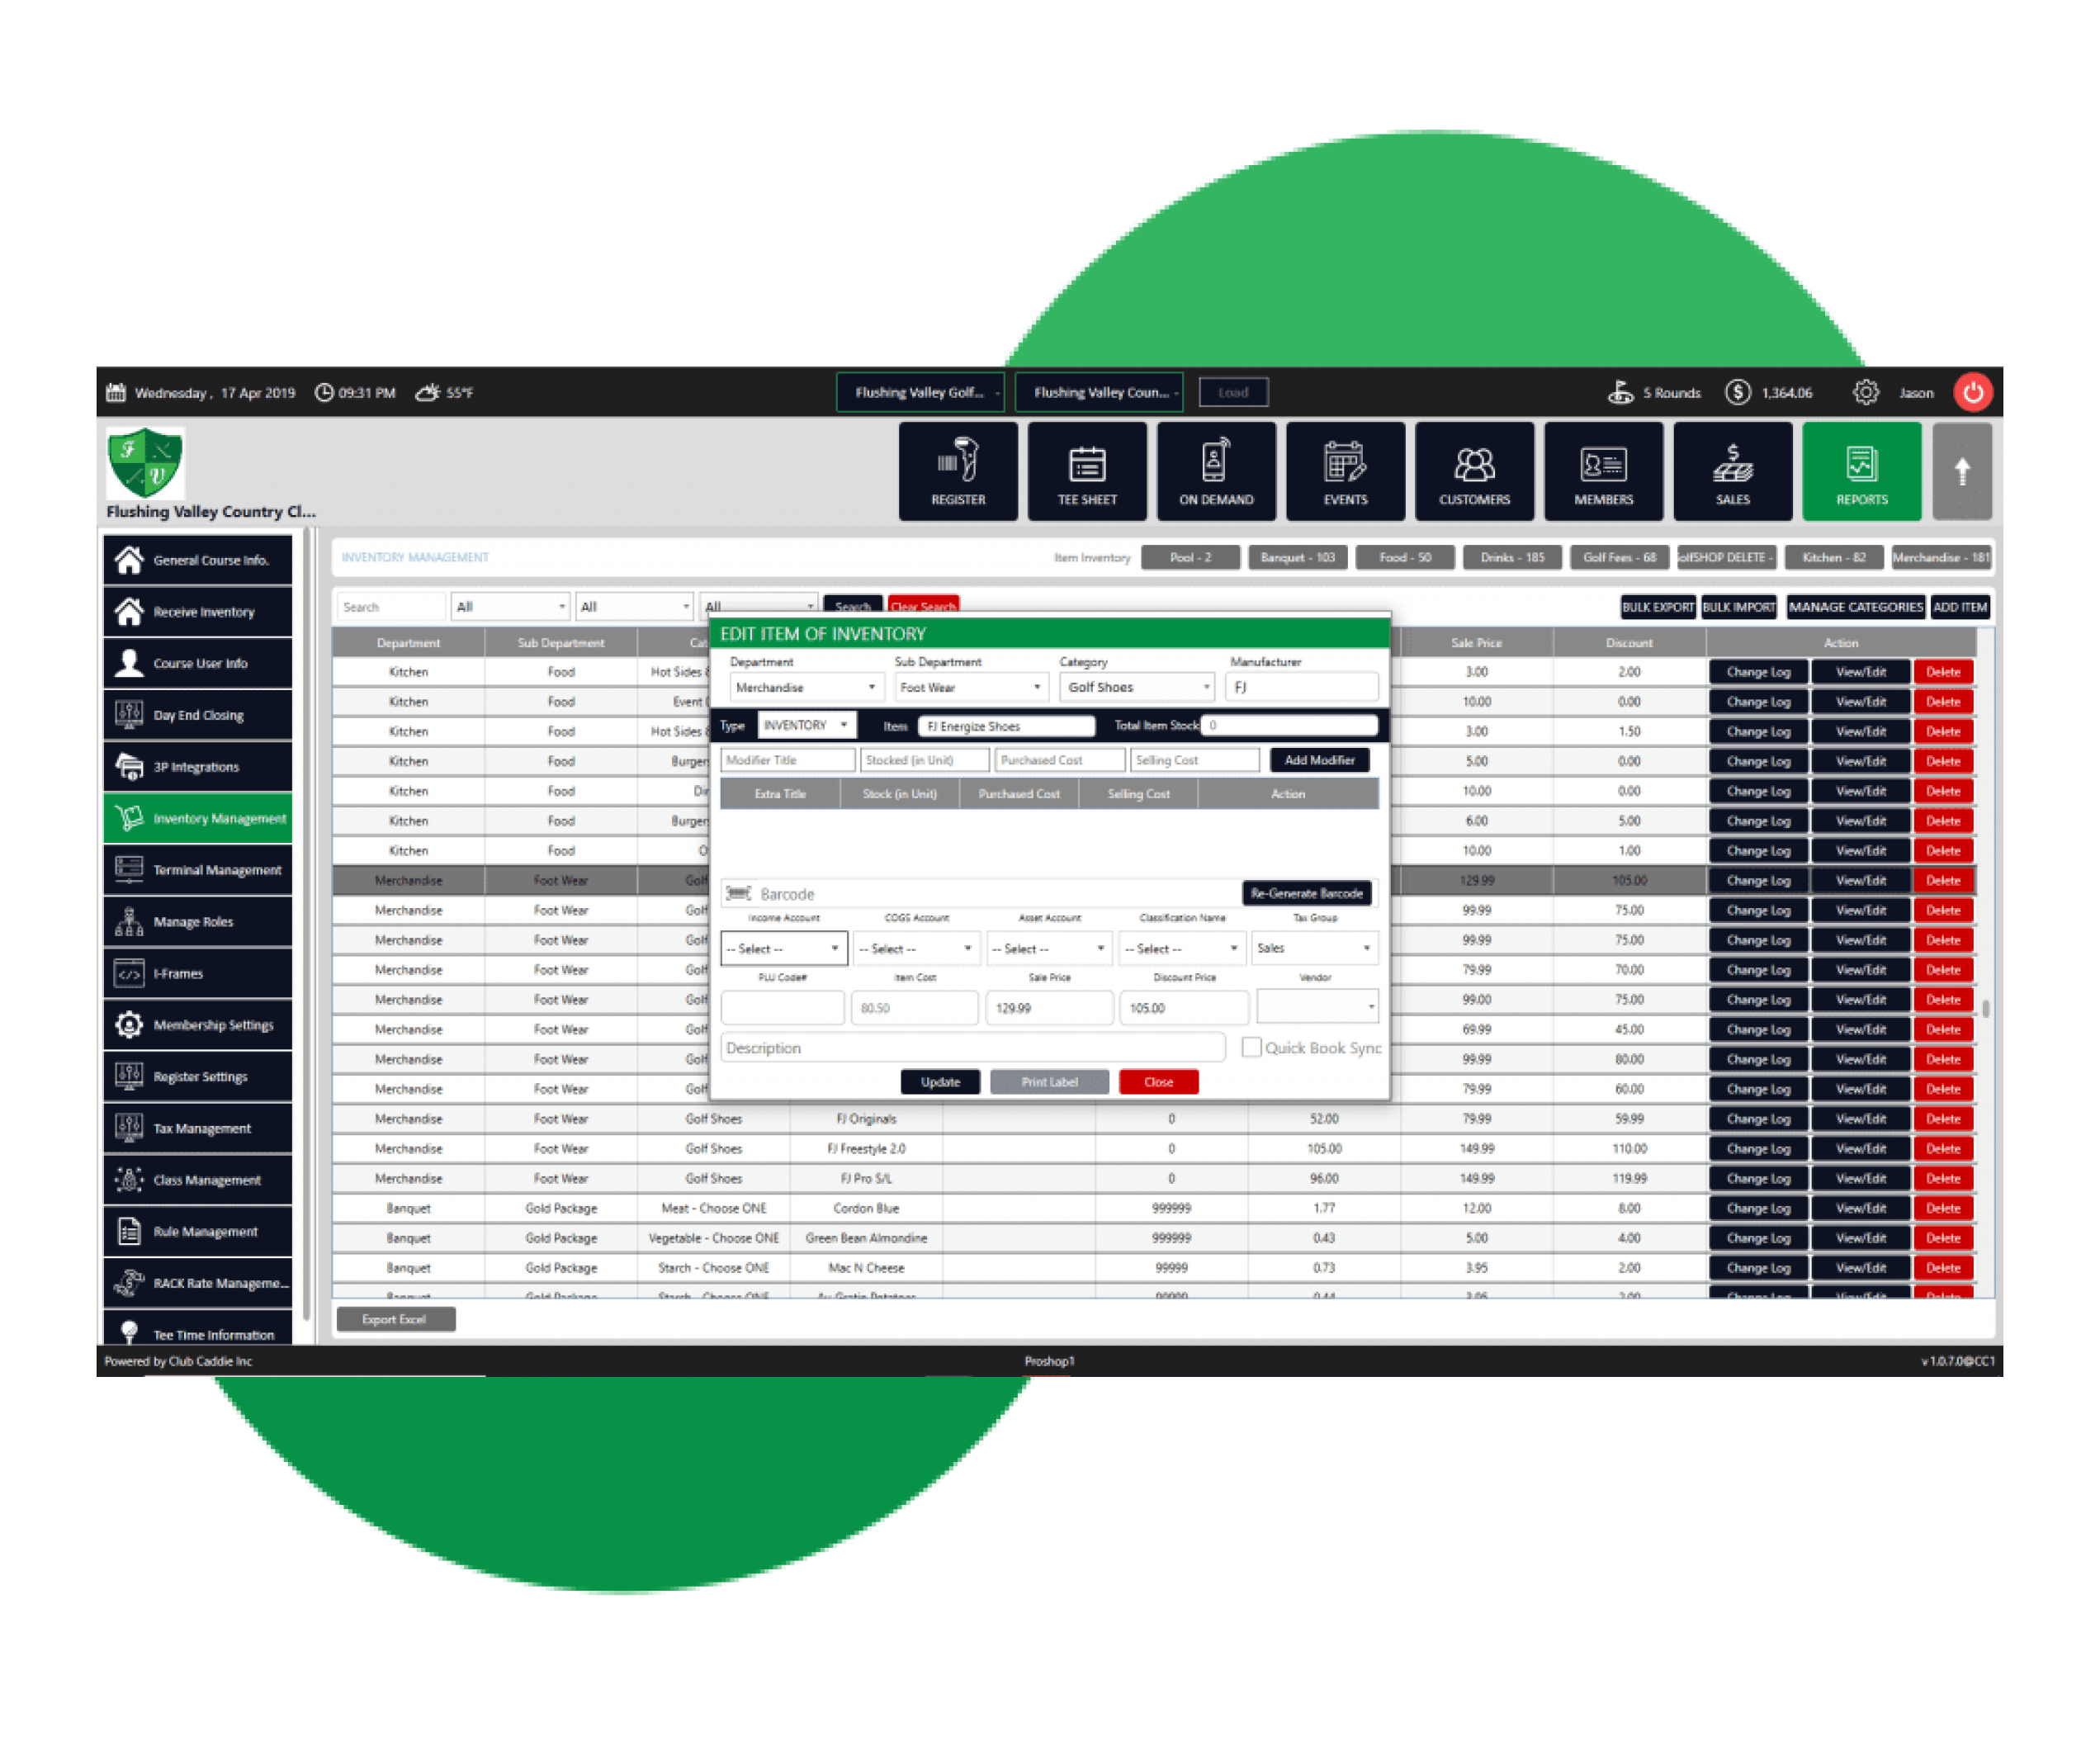
Full Inventory Tracking Suite
Receive Inventory, Track Costs, Map to Chart of Accounts
Organize inventory by department, sub-department, category and item. Add modifiers including upgrades and downgrades to any item. Generate barcode labels to scan items and print barcode labels with prices to attach to items
Don’t have time right now? Send us a message and we’ll get back to you right away.
We use cookies to ensure that we give you the best experience on our website. If you continue to use this site we will assume that you are happy with it.